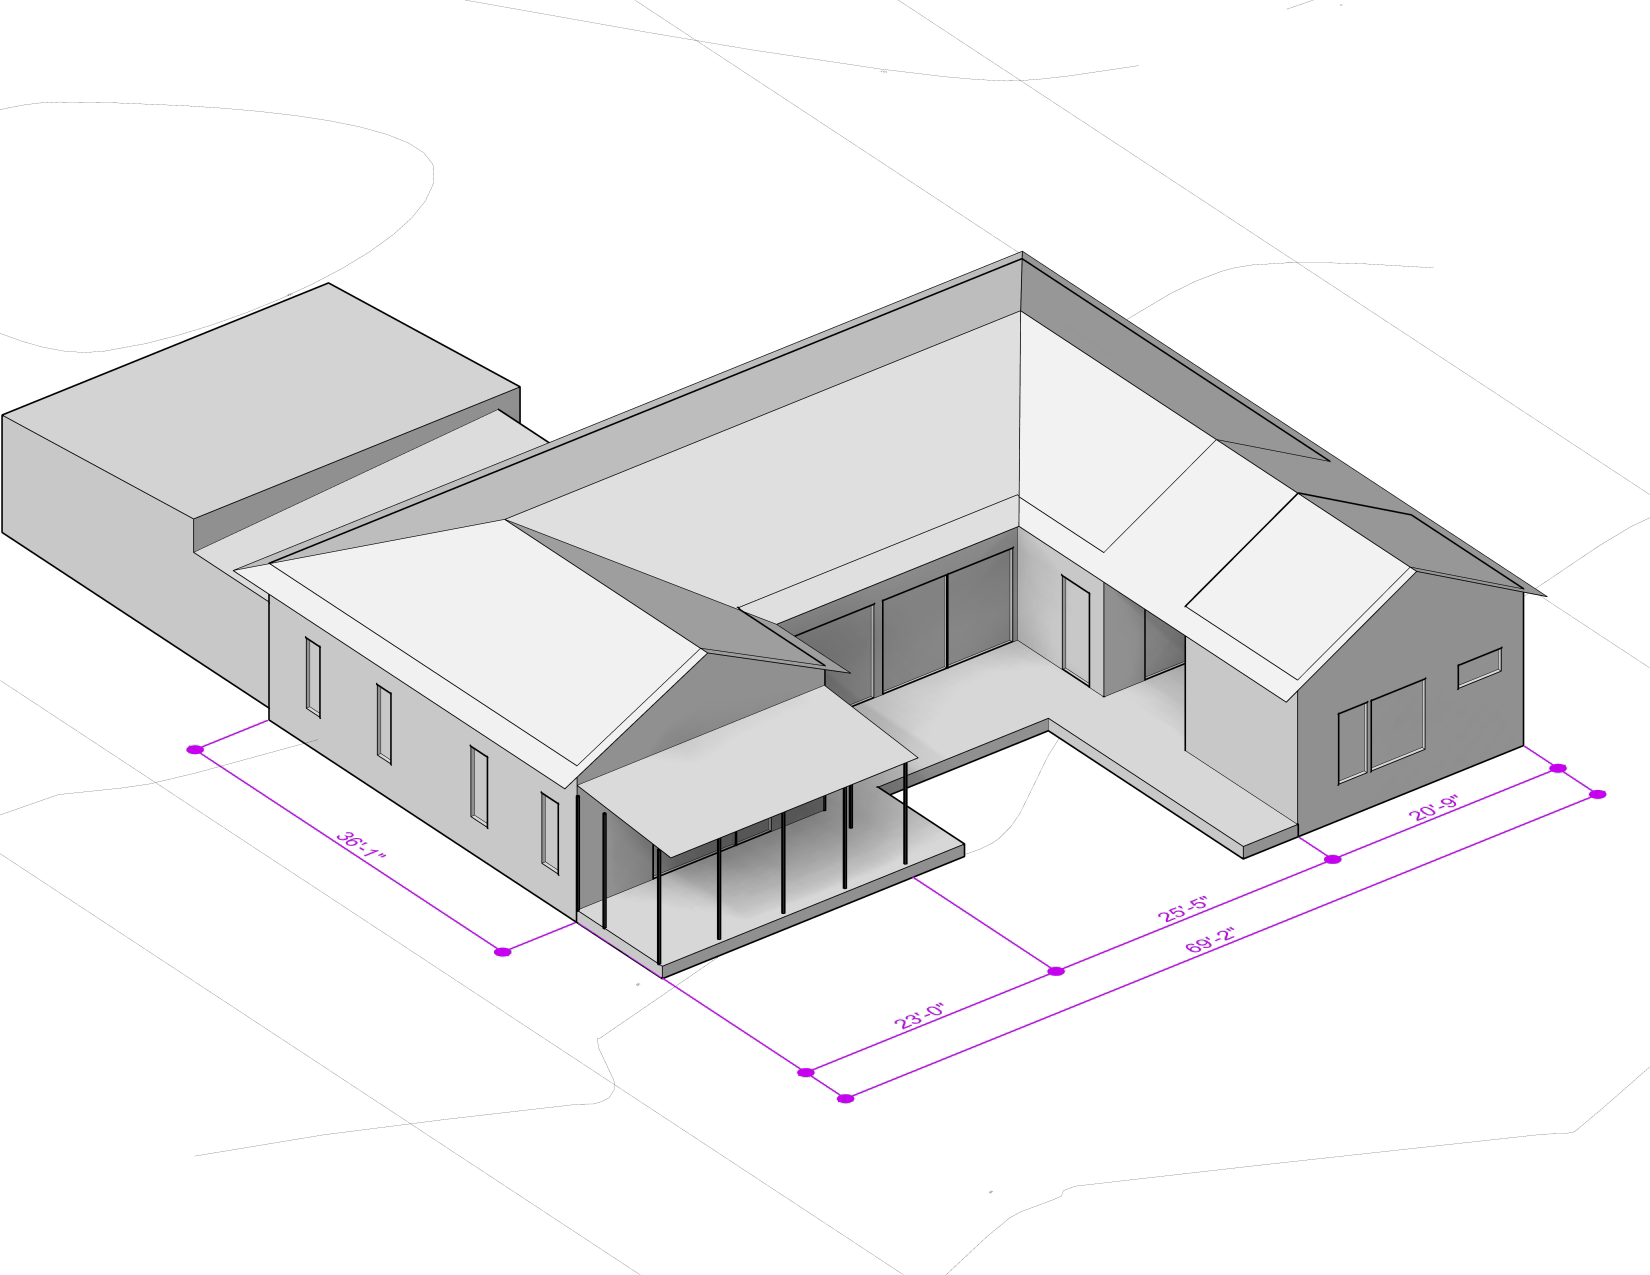
Modeled Geometry

For all model results show here, the following building geometry was used. This geometry is based on the CAD files received February 13, 2023. This model includes both the building itself as well as the local shading context. For details on the context shading see the windows site shading section

Isometric from Southwest including dimensions

*Treated Floor Area:
For any/all PHI energy model results, interior 'treated' floor areas are used for these cases. These areas are based on the European Standard for Residential Floor areas. For more for details as to which areas are included and which are excluded, see the standard DIN #277.

*Conditioned Floor Area:
For any/all Phius energy model results, interior conditioned floor areas are used for these cases. These areas are based on the Phius CORE 2021 rules, and more information can be found in the Phius rules document.


Source Energy Demand

'Source Energy' is the most important energy-use total to evaluate for any project. This figure translates the total yearly energy consumption of the building into a corresponding input energy value at the 'source'. This Source energy includes all the losses and inefficiencies in energy generation, delivery, and equipment. For Passive House certification the building must show that it has a very low total Source Energy. This total includes ALL the yearly heating, cooling, hot-water, lighting, appliance and other plug-load energy used by the building. This total energy is then factored by the respective fuel type for each use.* This figure can then be translated into a total Global Warming Impact figure (CO equivalent) for the building.

* Source Energy Factors:
The US EPA publishes regularly updated factors for the calculation of Source Energy. See the Energy Overview from the EIA at www.eia.gov/totalenergy/data/annual/ for more information.

** IPCC Source Energy Targets:
See IPCC (2016): Special Report: Global Warming OF 1.5 ÂșC (www.ipcc.ch)

Net Source Energy takes into account all of the losses and inefficiencies in generation and delivery.
Annual Source Energy Demand

A comparison of the Net yearly 'Source Energy' consumption for the tested versions of the building can be seen in the graph above. For reference, the full outline of tested variables used for these cases can be found in the detailed table below.

As shown, the building could achieve the Phius CORE certification target if desired. Achieving this very low level of source-energy consumption would mean driving down heating and cooling energy usage through a combination of improved glazing, improved mechanical systems, and utilizing the B.Public R-50 walls and R-80 Roof panels.


Passive House Performance Thresholds

In order to achieve the Passive House certification targets, 'Source' Energy is key, as shown above. However, Phius also requires that in addition to meeting the Source Energy target, the building must also meet additional heating and cooling annual energy demand performance targets. It is also required to satisfy the peak-heating and peak-cooling loads limits.

Shown below are results for these assessment metrics, for each of the tested variants.

Due to the large amount of north / north-west facing glazing this building will have a challenging time meeting the Phius CORE 2021 heating demand and peak-heat-load limits. In order to meet these targets using the highest performing B.Public panels (R-50 walls, R-80 roofs) will be required, in addition to using high performing glass and ERV equipment.

Annual Heating Energy Demand
Annual Total Cooling Energy Demand
Peak Heating Load
Peak Sensible Cooling Load

CO2e Emissions

Carbon Dioxide and other types of pollution which results from energy consumption are mainly responsible for the increased warming of the earth's atmosphere and water. In order to reduce the risk of global climate change it is important to reduce all CO2e (CO2 Equivalent) emissions related to buildings, industry and transportation across all sectors. While there is much debate about the specific targets these reductions should achieve, one useful method suggests that by 2030 each individual will need to meet an annual 'Carbon Budget' of roughly 2.3 tons-CO2e per person for all activities. This would mean that an average individual's annual carbon emissions might include approximately 1 ton-CO2e / year related to housing and building inhabitation, 1 ton-CO2e / year for transportation and another 0.3 tons-CO2e / year for food. For reference, a single US-to-Europe round trip flight currently releases approximately 4 tons of warming gases into the atmosphere. This 1 ton/person target for building emissions gives us a useful benchmark for this building's annual CO2e emissions. Given an average annual occupancy of approximately 3 people (num. bedrooms + 1), this building should ideally see a total annual CO2e emissions footprint of less than about 3 tons-CO2e / year.

Based on the modeled source energy and fuel types for the various energy uses of the building we can approximate the average annual CO2e emissions which will result. CO2e emission totals shown below are those which result from fuel usage by the building for heating, cooling, hot-water and all other plug-loads. The total amount of CO2e emitted as a result of each use-type depends on both the amount of fuel used as well as the type of fuel (gas, electricity, etc..).

Annual CO2e Emissions due to Operational Energy Consumption

For all values shown in the graph above, EPA regional fuel conversion factors are used. In particular:

  • Electricity: 642.9 lbs CO2e/MWh × ( 0.0004536 metric tons/lb) × 0.001 MWh/kWh = 0.0002916 metric tons CO2/kWh
  • Natural Gas: 399.5 lbs CO2e/MWh × ( 0.0004536 metric tons/lb) × 0.001 MWh/kWh = 0.0001812 metric tons CO2/kWh


Electricity Emission Rates used are from the SRVC (baseload). For more information on these factors see the EPA eGrid Data and Summary Tables and Guidance on the Use of eGRID Output Emission Rates. Source Energy Factors for all fuel types are taken from the EPA EnergyStar Portfolio Manager Technical Reference (2018)


Modeled Variants

As shown in the graphs above, in order to assess the building performance relative to the Phius CORE Certification performance standard, we have tested the building in five distinct configurations:

  1. Code Minimum: A version which just meets the 2018 North Carolina Residential Code / Climate Zone 4a code minimums for insulation envelope R-Values, air-tightness and equipment efficiencies.
  2. with B.Public R35/R59: A version which improves the wall, roof and floor insulation R-Values beyond the levels required for compliance with the NC building code. This variant assumes the use of the B.Public R35 walls and R-59 roof panels. This variant also assumes meeting a total building air-change-rate of <1.0 ACH@50Pa
  3. Add PH Windows: A version which improves the windows beyond code-minium to Passive House levels of performance.
  4. Add PH ERV [Recommended]: A version which adds a high performance Passive House ERV (Energy Recovery Ventilator) to the building's HVAC system which will allow for good heat-recovery efficiency.
  5. with B.Public R52/R80: A version which improves the buildings performance specifications to the level required for full Phius CORE certification. This primarily entails upgrading the wall and roof panels to teh R-50 and R-80 options respectively.
A full outline of tested variant inputs and key outputs can be found in the table below:

*Envelope R-Values:
Note that effective R-Values (including repeating thermal bridges) are shown here. These values are taken from the 2018 North Carolina Residential Code / Climate Zone 4a minimum compliance values.

**Thermal Bridging Allowance:
This is a % increase in the overall heat-loss of the building. Instead of performing detailed Thermal Bridging calculations, this value is based on past experience only and should be understood as a rough estimate or allowance.


Energy Model Climate Data


For all the modeled cases shown in the following sections, climate data from the nearest weather station was used.
(Raleigh-Durham Intl AP :: 723060 :: TMY3). EPW Weather Files

The data from this climate set is illustrated here for reference purposes. It should be noted that for the PH-Model model, monthly average climate data are used and therefor may appear different from the more typical ASHRAE hourly data shown in some other US Energy Modeling programs. The monthly data is all derived from the same sources (local weather stations) as the typical ASHRAE data however.

Raleigh-Durham Intl AP (NC USA): Monthly Avg. Outdoor Temperatures
Raleigh-Durham Intl AP (NC USA): Monthly Avg. Solar Radiation

| PASSIVE HOUSE?

The following is for informational purposes only.

Passive House is the most challenging energy standard for buildings employed around the world today, with a strict cap on heating, cooling, hot water, lighting and appliance energy use. By successfully employing Passive House methods, a comfortable, durable and sustainable building can be created which uses only a tiny fraction of the energy that a 'conventionally built' structure would.

Passive House Certifications

The 'Passive House' standard was first developed as a standard for new construction by the Passive House Institute (PHI) in the early 1990's. Since that time, there have been several new pathways to certification developed which are now available to buildings. While we do not recommend that this building pursue this level of performance, the Passive House certification is used as a good 'reference' level to show what a high-performance building would perform like in this climate. Passive House buildings can be certified in various ways, including:

+ PHI New Construction

+ PHI Low Energy Building

The Phius standard was first developed as a standard for new construction in 2015 by the Passive House Institute of the US (Phius). Since that time, there have been several updates and new pathways to certification developed which are now available for development teams. Currently, Phius buildings can be certified in various ways, including:

+ Phius CORE 2021

+ Phius Source Zero 2021